President Trump recently renewed his tariff threats to Canada. Among the issues cited by US officials and industry groups is Canada’s administration of dairy tariff-rate quotas under the Canada-United States-Mexico Agreement (CUSMA). The United States complains that the Canadian government administers dairy import rights in a way that prevents the full use of market access granted in CUSMA. In particular, the US claims that Canadian retailers should be made eligible to import dairy products from the United States. At times, it seems that President Trump wants the US to have full access to the Canadian dairy market. But, since that’s not what was negotiated in CUSMA, I’m not going to elaborate on that kind of request.
I plan to write two posts on access to Canada’s dairy market. In this first post, I provide background information about the import of dairy products in CUSMA. I largely avoid legal issues other than summarizing the main elements of the dispute. I focus on trade data and a description of the economic issues. In a second post, I will use economic analysis to show that giving import allocations to retailers would not increase imports of dairy products from the United States.
The Canada-US dairy disputes
In December 2020, just a few months after CUSMA entered into force, the United States initiated the CUSMA dispute settlement process regarding Canada’s administration of its dairy TRQs. The US claimed that Canada’s practice of reserving 85 to 100% of dairy Tariff Rate Quotas (TRQs) to processors and further processors was inconsistent with Canada’s obligations.1 TRQs include an import quota, and it is the allocation of that quota among businesses that is the subject of the dispute. I explain how TRQs function below.
The United States requested the establishment of a panel to examine the dispute in May 2021. Mexico joined as a third party a few days later. Hearings took place in October 2021 and the panel released its report in December 2021.
The Panel ruled in favour of the United States, stating
the Panel finds that Canada’s practice of reserving TRQ pools exclusively for the use of processors is inconsistent with Canada’s commitment in Article 3.A.2.11(b) of the Treaty not to ‘limit access to an allocation to processors.’
In response, Canada modified in May 2022 the allocation methods for the CUSMA dairy TRQs such that there is no longer a reserved share of TRQs to processors. The dairy TRQs are allocated among eligible applicants using a market-share mechanism.
The United States was not satisfied with the modifications and initiated a second dispute after the publication of the new allocation methods. The United States requested the establishment of a panel in January 2023 and Mexico joined as a third party soon after. There were four elements to the US position:
- Type of entities who can receive an import allocation, specifically that retailers are not eligible for import allocation;
- Allocation based on a market share basis;
- 12-month activity requirements for a business to be eligible for an allocation;
- Mechanism for the return and reallocation of unused allocations.
The Panel’s report was published in November 2023. For the first three claims, the Panel ruled that Canada’s measures were not inconsistent with the agreement. For the fourth claim, the Panel was unable to find that Canada’s measures were inconsistent.
In a press release, Ambassador Katherine Tai expressed disagreement with the Panel findings:
Despite the conclusions of this report, the United States continues to have serious concerns about how Canada is implementing the dairy market access commitments it made in the Agreement. While the United States won a previous USMCA dispute on Canada’s dairy TRQ allocation measures, Canada’s revised policies have still not fixed the problem for U.S dairy farmers. We will continue to work to address this issue with Canada, and we will not hesitate to use all available tools to enforce our trade agreements and ensure that U.S. workers, farmers, manufacturers, and exporters receive the full benefits of the USMCA.
Since then, the US has repeatedly expressed discontent regarding Canada’s CUSMA dairy TRQ allocation methods.
Canadian dairy imports
In this section, I present data for Canada dairy imports. As I will explain below, there are annual quotas for the import of dairy products under CUSMA. These quotas are not filled, and that has been a source of frustration to the United States. There are also import quotas for other trade agreements. I will show below data for dairy import quotas for CUSMA, the Comprehensive and Progressive Agreement for Trans-Pacific Partnership (CPTPP) and the Canada-European Union Comprehensive Economic and Trade Agreement (CETA).
The figures below show data from the Government of Canada. The figure shows the access quantity (the quota amount), the permit quantity (the import quantity), and the utilization rate (i.e., fill rate), calculated as the ratio of permit quantity to access quantity.
Import control for supply-managed products uses TRQs. I explain in the next section how they work. For now, let me just say that they are a combination of tariffs and a quota. The focus here is on the utilization rate for the quota part of TRQs. There are TRQs for product groups and trade agreements, each with different access quantities. The quota usually increases annually according to schedules elaborated in the trade agreements. Some TRQs are defined over the dairy-year, from August to July, and others over the calendar-year.
CUSMA
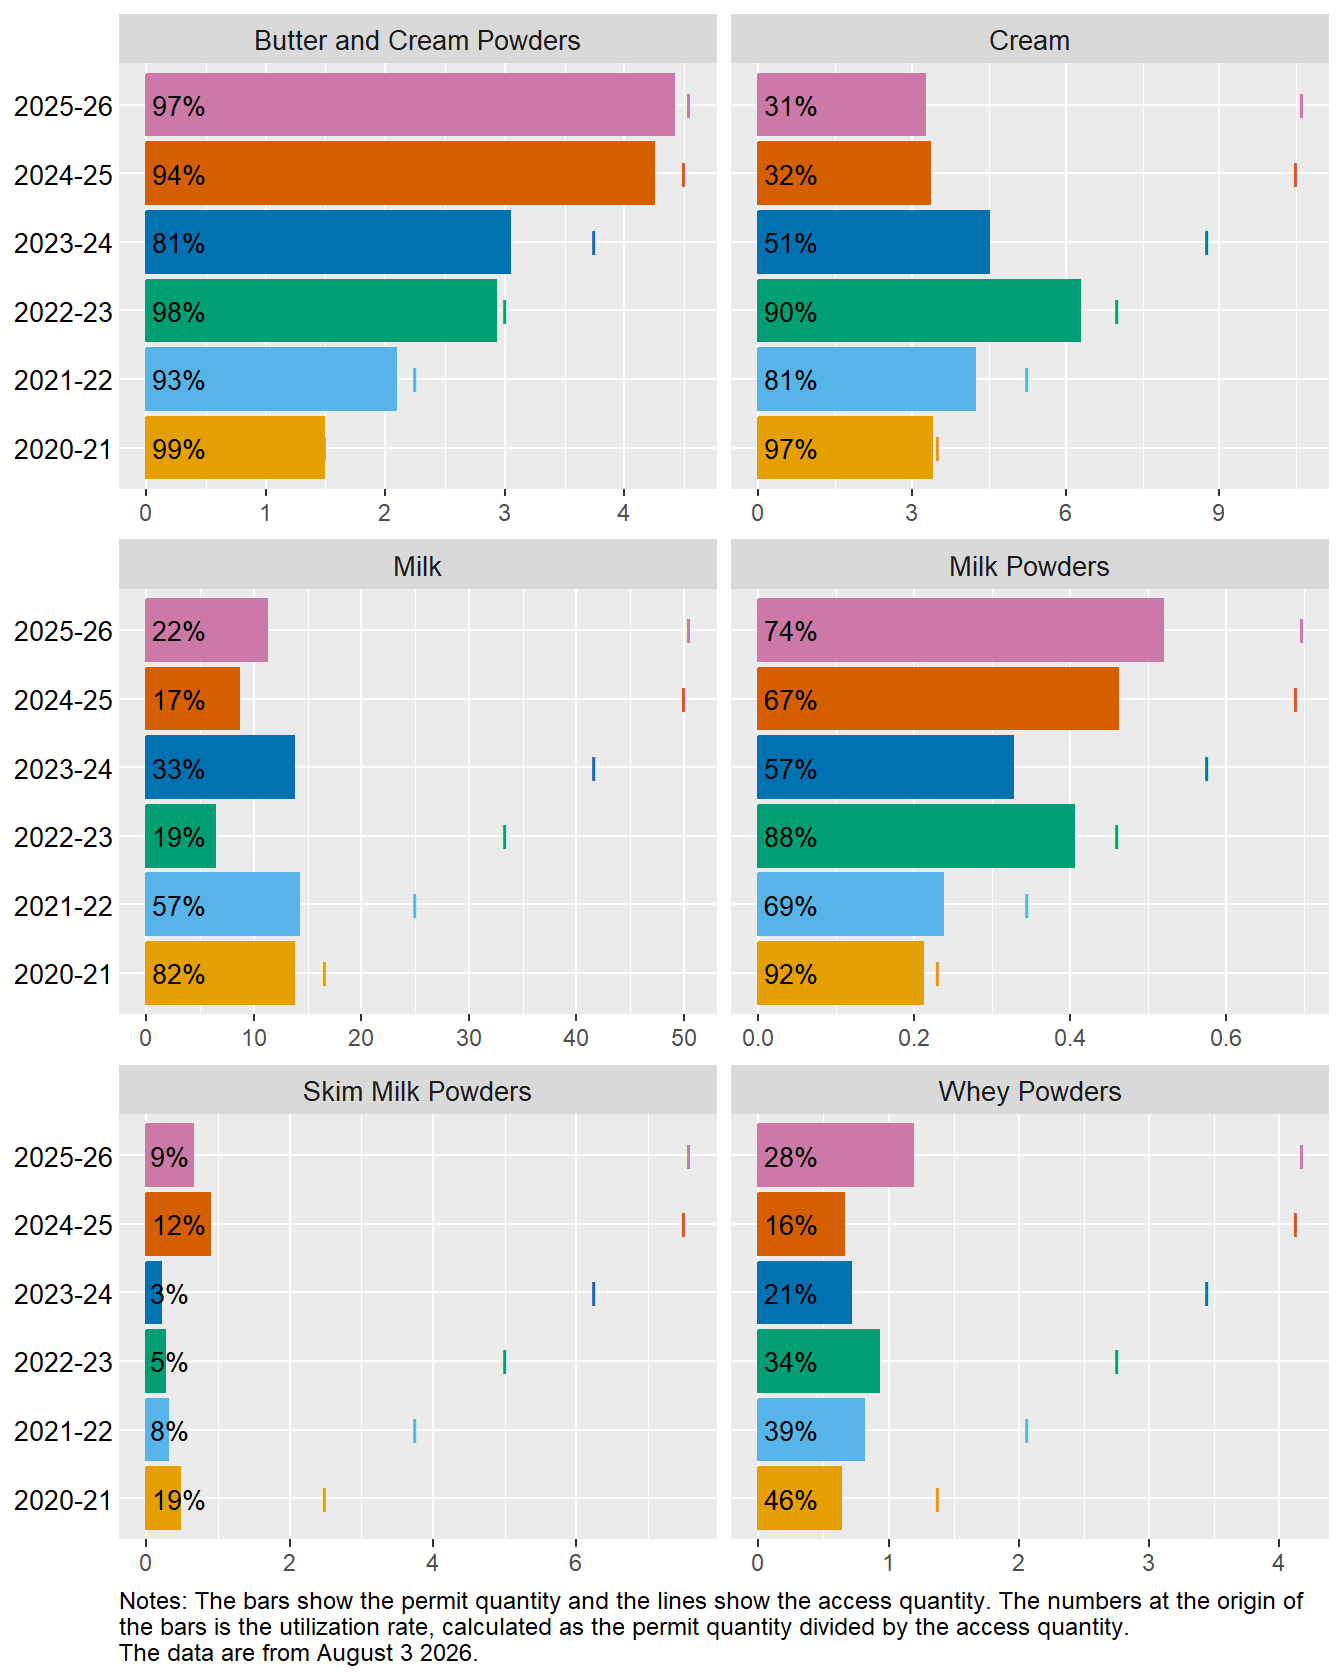
Figure 1 shows utilization data for CUSMA TRQs on a dairy-year timeline. Figure 2 shows utilization for CUSMA TRQs on a calendar-year timeline. In each figure, the bars show the permit quantity, the small vertical lines show the access quantity. At the origin of each column is the utilization rate, calculated as the permit quantity divided by the access quantity.
Figure 1 and Figure 2 show that access quantities have been growing annually. The rate of growth has slowed down. In the first six years of CUSMA, the access quantities were set to increase by nominal values each year. After those six years, the access quantities increase slower, by 1% annually, until reaching their final scheduled level in year 19.
The utilization rate varies significantly by TRQ. For the TRQs on a dairy-year timeline in Figure 1, the utilization rate for Butter and Cream Powders is more than 95% in 2025-26 even though the access quantity has grown annually. Butterfat has been historically the relatively scarce component in Canada. The utilization rate for Cream is lower. This could be because it is costlier to transport and store cream than it is for butter. Imports of Milk have been relatively stable. Firms typically do not import milk from the United States and these imports are likely imports by individual consumers. Imports of Milk Powders have been trending up at a pace that has nearly matched the pace of increase of the access quantity. Imports of Skim Milk Powders are small. Imports of Whey Powders have been relatively stable and the utilization rate has declined.
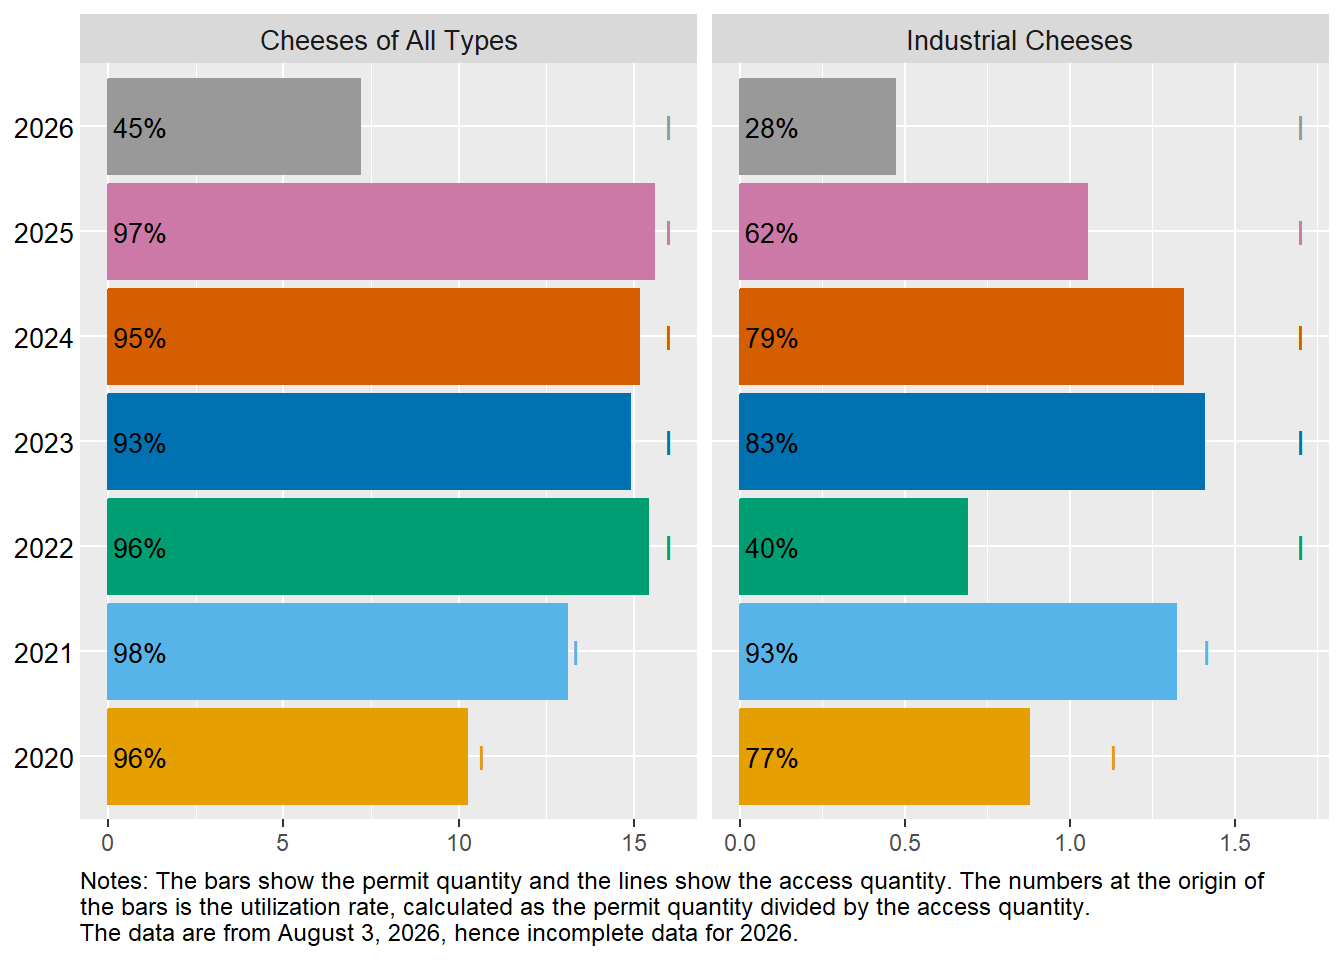
The data for 2026 in Figure 2 are incomplete as they were collected in August. The utilization rates are low for Concentrated and Condensed Milk, Powdered Buttermilk, Yogurt and Buttermilk and Other Dairy. These products are relatively abundant in Canada. The import quota for Cheeses of All Types is virtually filled every year. For Industrial Cheeses, imported as big blocks to use in the production of frozen pizzas and similar products, imports have trended up and so has the utilization rate. For 2026, the utilization rate should be similar to 2025 given the progress so far. Imports of Products Consisting of Natural Milk Constituents (NMC) vary significantly every year. After a record year in 2025, only small volumes have been imported so far in 2026.
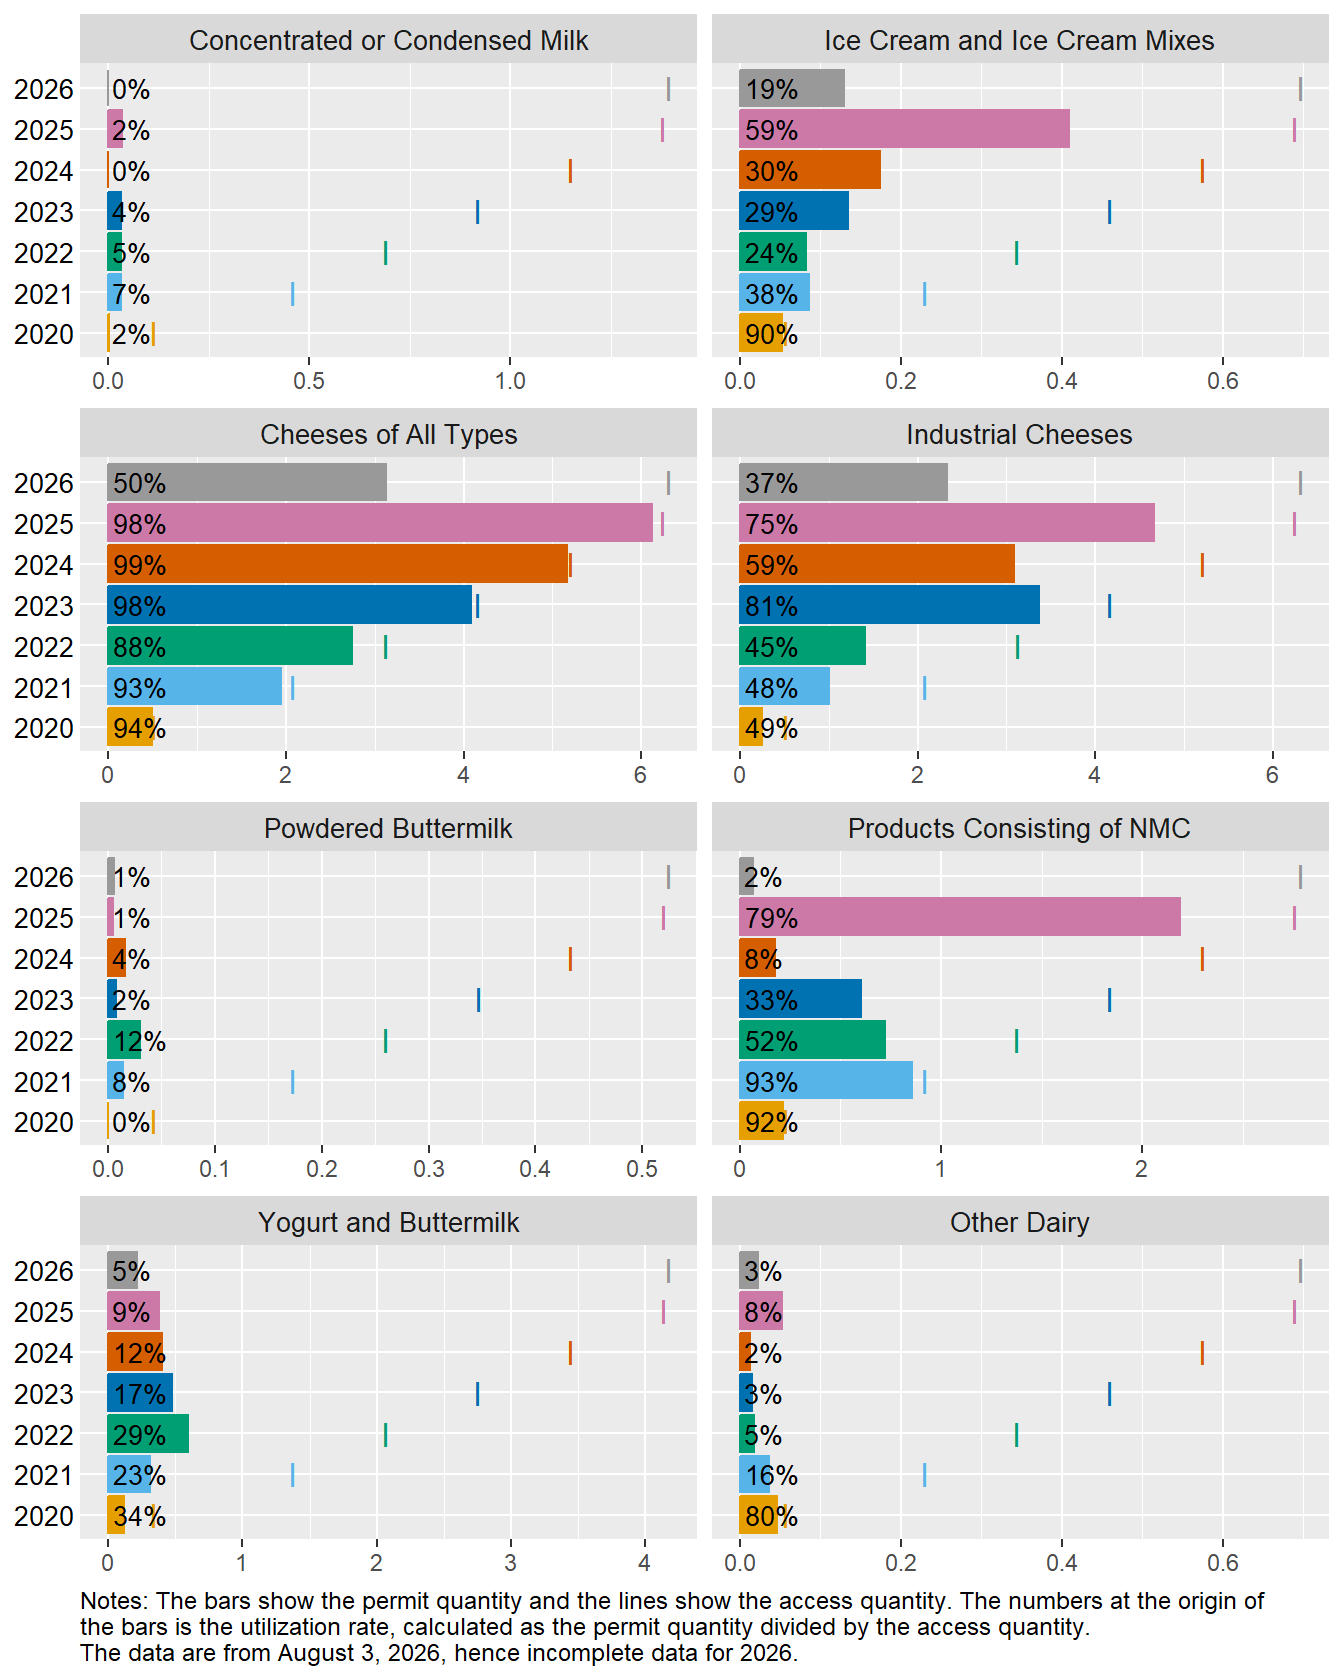
Figure 1 and Figure 2 show that utilization rates vary greatly by products. Canadian firms tend to import products that are relatively more expensive in Canada than the United States: butter, cheese, and milk powder.
CPTPP
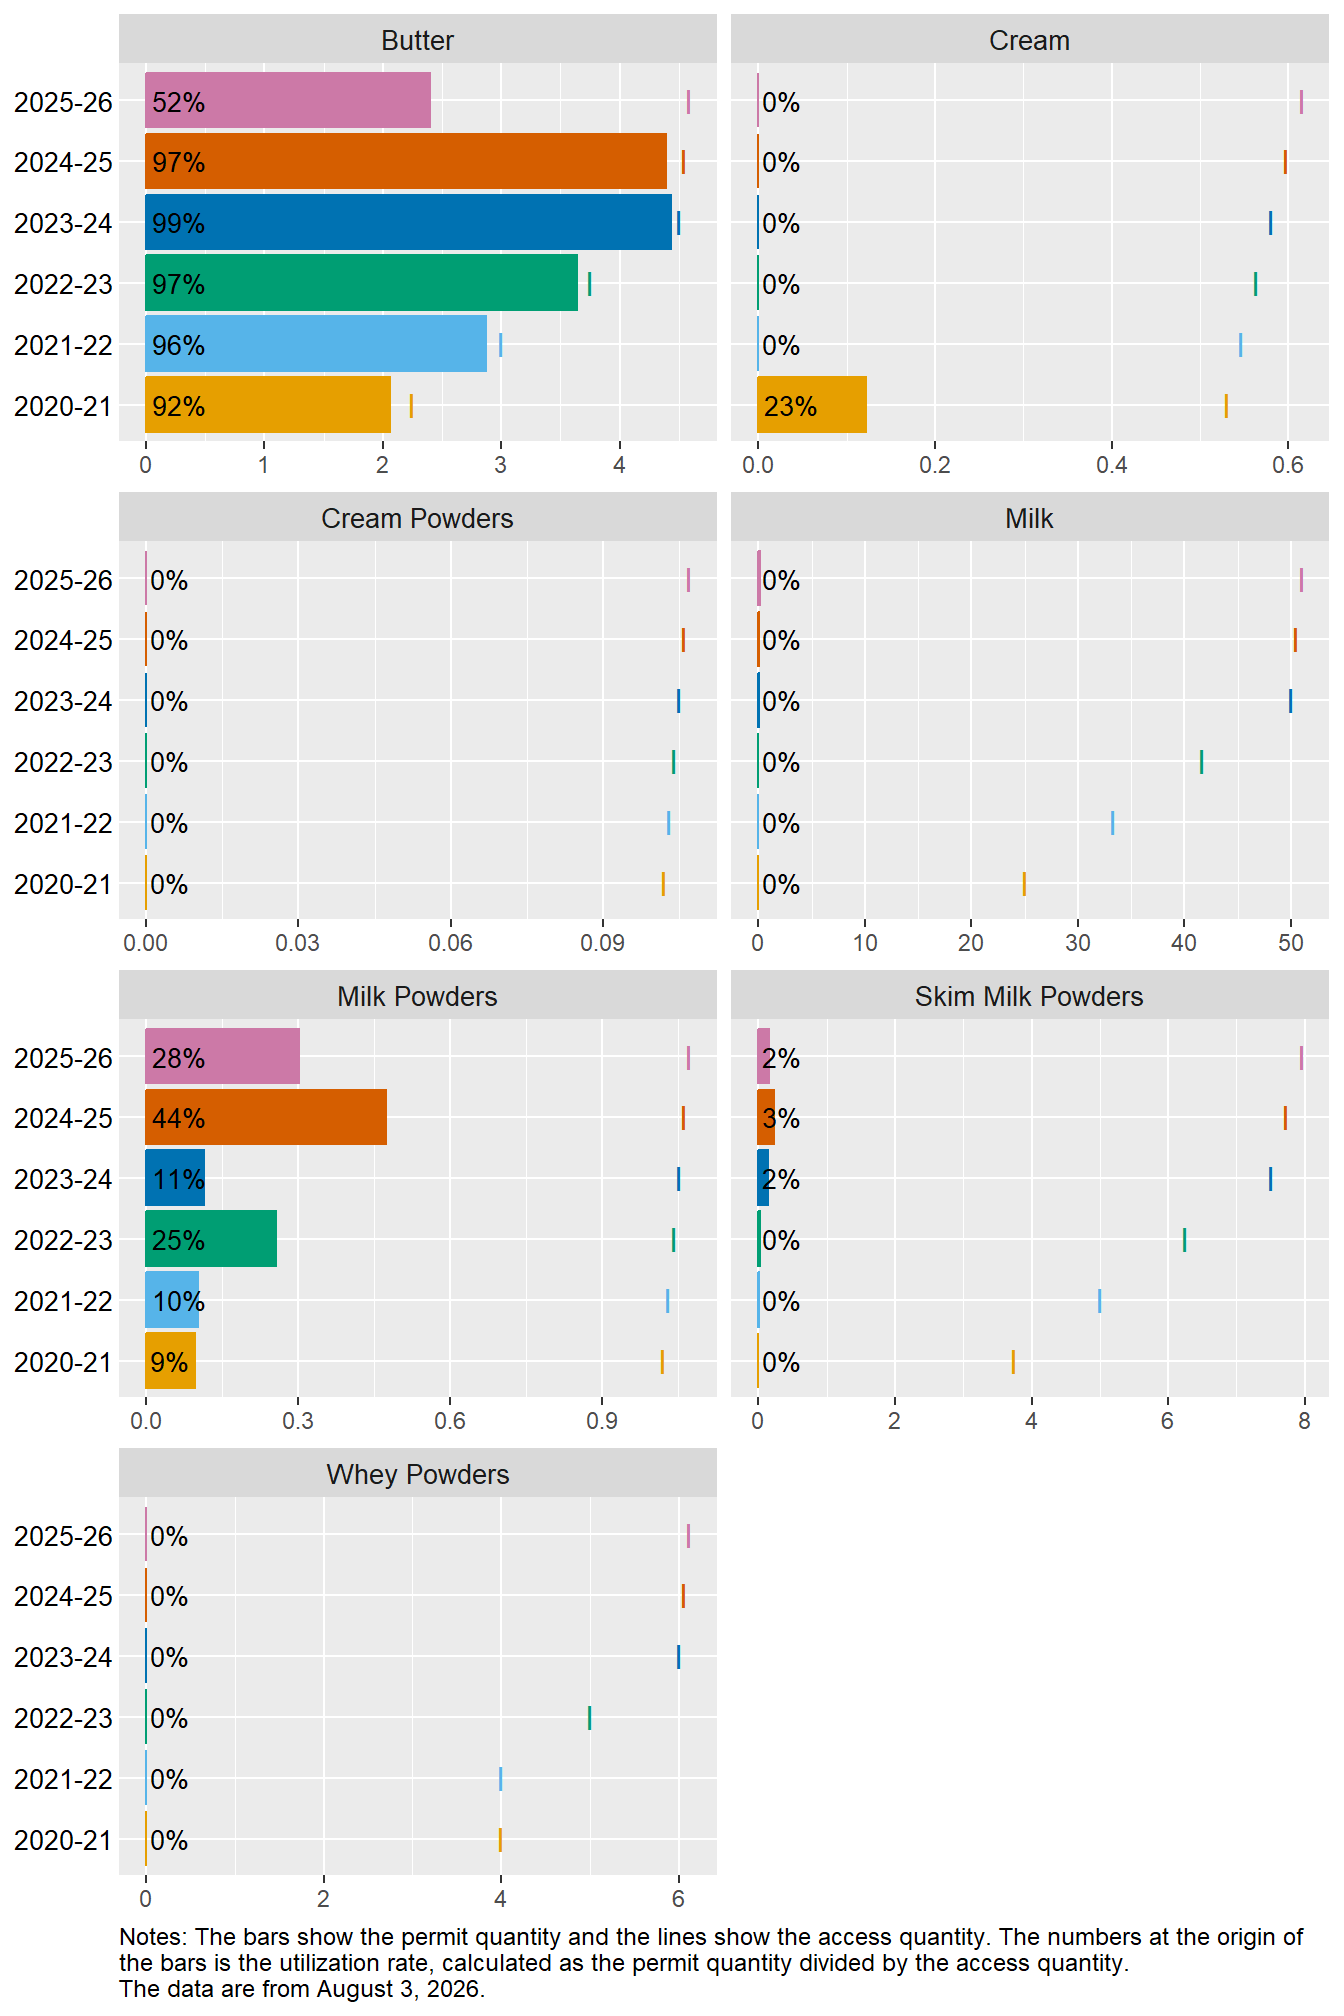
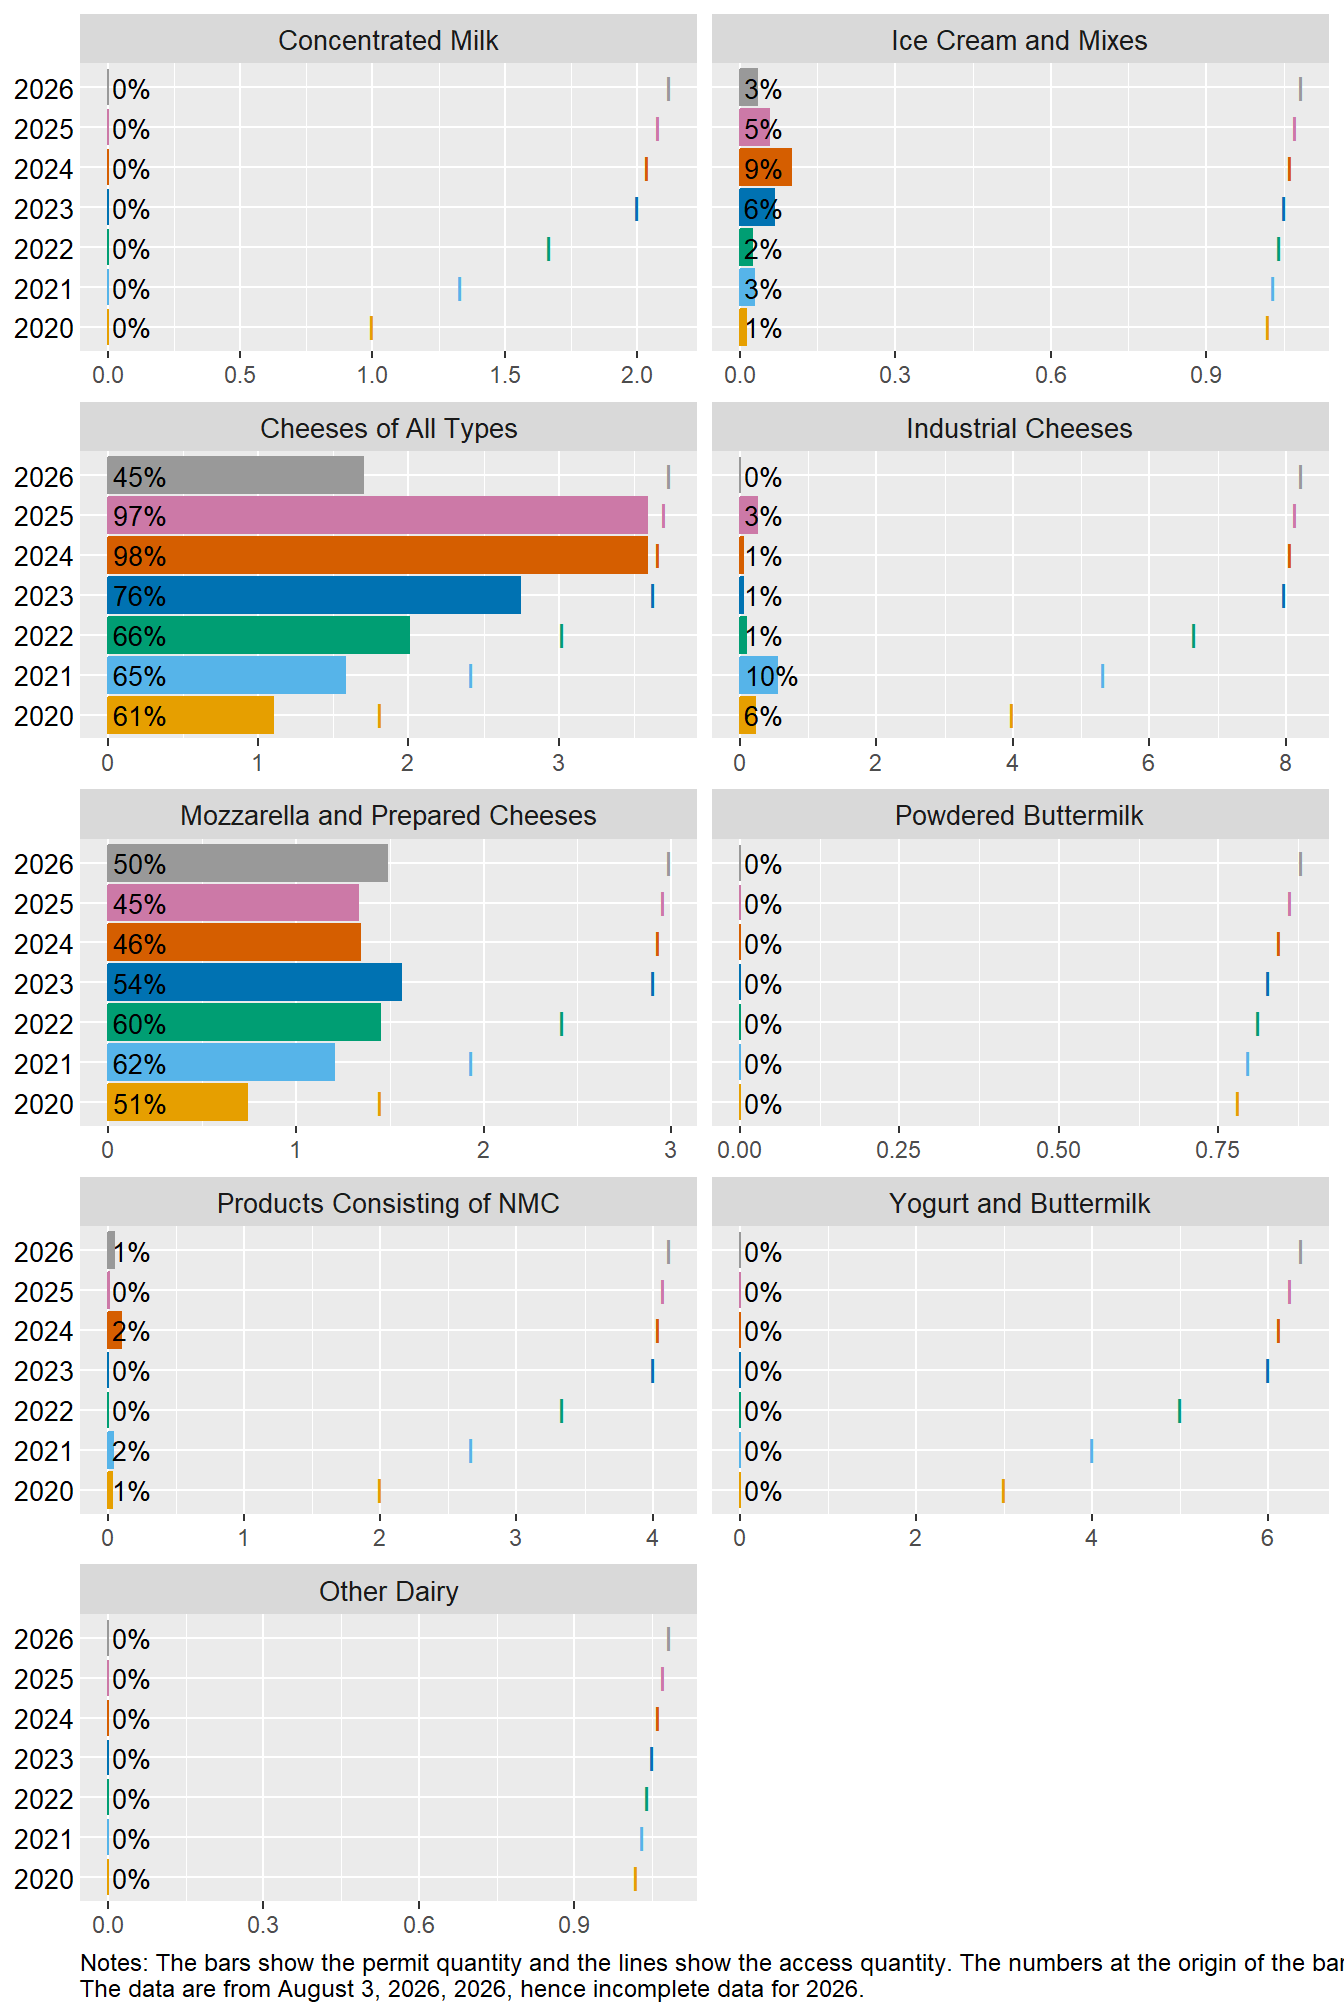
Figure 3 and Figure 4 show utilization data for CPTPP. The agreement entered into force on December 30, 2018. I show data starting in 2020.
For products on a dairy-year timeline in Figure 3, Butter stands out with virtually 100% utilization rate. Most of Canada’s butter imports under CPTPP are from New Zealand. Canada also imports butter from New Zealand under the WTO agreement. Figure 3 shows that Canada imports some Milk Powders but virtually nothing for the other products on a dairy-year timeline.
Utilization data for CPTPP dairy imports on a calendar timeline are in Figure 4. Import volumes are small except for Cheeses of All Types and Mozzarella and Prepared Cheeses. The TRQ for Cheeses of All Types was nearly filled in 2024 and 2025 and we can expect a high utilization rate again in 2026. Imports of Mozzarella and Prepared Cheeses have been fairly constant since 2022. However, imports of Industrial Cheeses are almost zero.
Out of the CPTPP countries, besides Canada, only Australia and New Zealand are significant dairy producers and both are far away from Canada. Importing perishable dairy products can be costly, especially those with a high-water content. It is fairly cheap to ship butter, cheese and powders in containers.
The pattern we observed for CUSMA is even more present for CPTPP. With distance adding costs, it is not surprising that Canada imports fewer dairy products from CPTPP countries than from the United States. However, the products that Canada imports in larger quantities are the same: butter and cheeses.
CETA
CETA provisionally applies since September 2017 because not all European countries have ratified the agreement. I show in Figure 5 only utilization data starting in 2020. The import quota for Cheeses of All Types has been filled virtually every year. This TRQ includes differentiated cheeses like Brie, Comté, Camembert, Gorgonzola and Parmigiano Reggiano. Imports of Industrial Cheeses, which is undifferentiated commodity cheeses, are much smaller. Like the other two trade agreements, the import quota for Cheeses of All Types is nearly filled.
The economics of tariff rate quotas
Canada uses TRQs to control imports of products that are under supply management. What follows is a standard explanation of the economics of TRQs. I will show the economic conditions in which the import quota is filled, underfilled or overfilled.
Figure 6 shows the basic economics of TRQs. Standard economic assumptions apply: no differentiation between the imported product and the domestic product, and perfect competition. The import quota is \(Q\). It represents Canada’s access commitment to imports. The figure assumes a constant world price \(W\), which is consistent with Canada being small in the world dairy market. The world price is CIF in the importing country, meaning that it includes transportation and insurance costs. The in-quota tariff, \(t\), is in percentage and likewise for the over-quota tariff \(T\). Often, in in-quota is zero but for illustrative purpose I consider \(t>0\). The over-quota tariff \(T\) is generally set high, sometimes in excess of 200%, such that imports in excess of the quota rarely happen. With the TRQ, the export supply equals \(W(1+t)\) for volumes between \(0\) and \(Q\), then it is vertical at \(Q\) between \(W(1+t)\) and \(W(1+T)\) and finally it equals \(W(1+T)\) for volumes greater than \(Q\).
The utilization rate depends on the strength of the import demand relative to the world price. Figure 6 considers four levels for the import demand. When the demand is low at \(D1\), it does not cross the export supply and there is no volume imported under the TRQ. In this case, even with \(t = 0\), there would be no import. For a demand at \(D2\), the price inclusive of the tariff is \(W(1+t)\) and the import volume is \(M2 < Q\) such that the import quota is partially filled. With the demand at \(D3\), the import volume is \(M3=Q\), the import quota is entirely filled, and the price is \(P\). In the case where the demand is at \(D4\), the price is \(W(1+T)\) and the import volume \(M4\) exceeds the import quota.
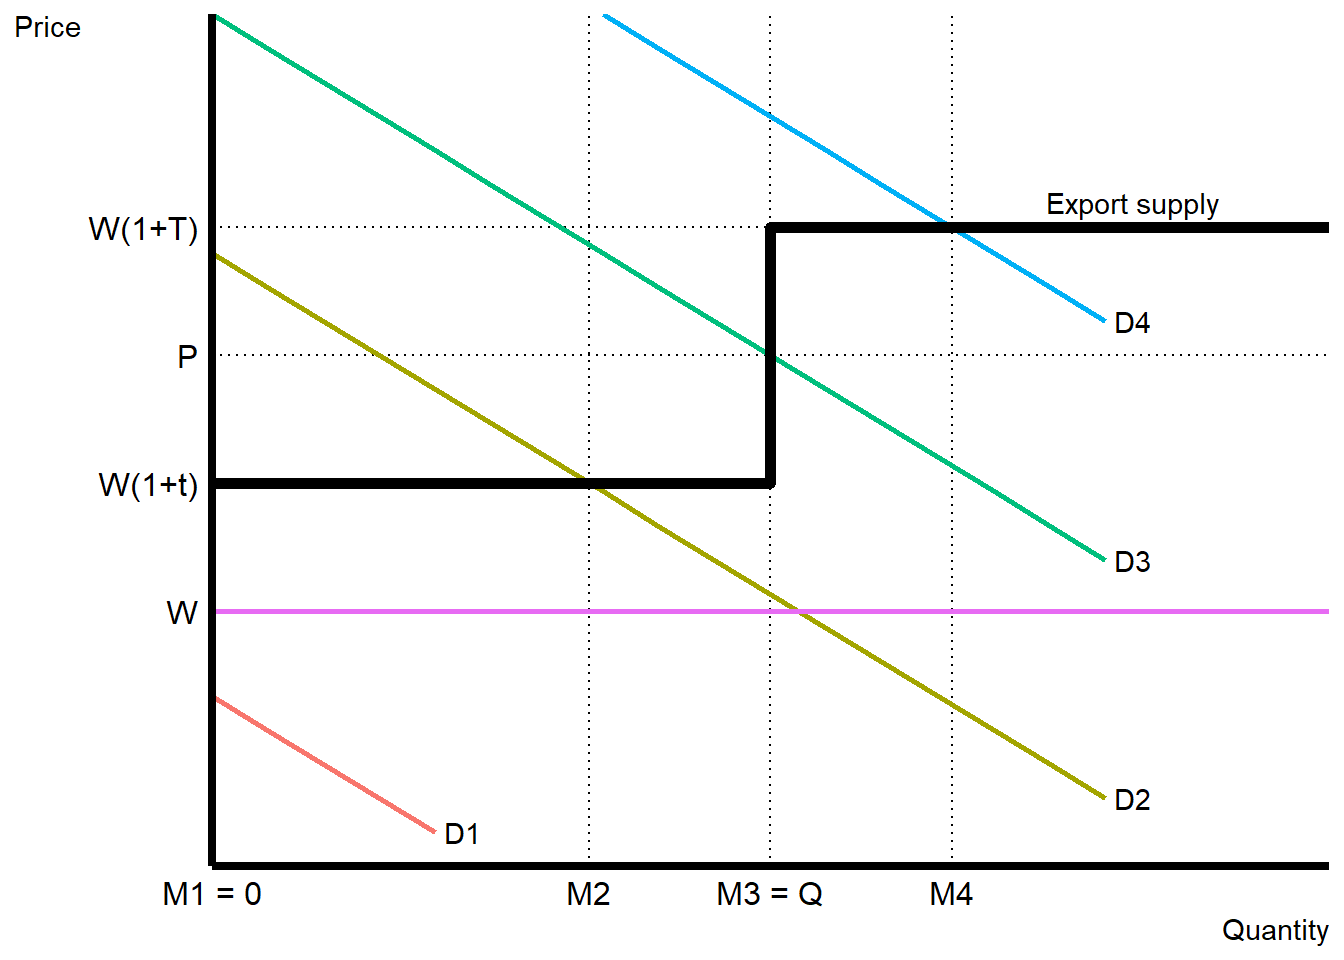
Figure 6 shows that low import demand, \(D1\) or \(D2\), is an economic reason for low TRQs utilization rates. Figure 6 also shows that when the demand is strong, \(D3\) or \(D4\), the quota is filled. The utilization rate, therefore, depends on the strength of the import demand relative to the world price.
Allocation of Canada’s supply-managed tariff rate quotas
Firms who have permits to import within access commitments, that is at the low import tariff, can earn significant profit if the import price is low and the import demand is strong. This can make certain import permits highly desirable.
Within access commitments for the 12 CUSMA dairy TRQs are allocated to three eligible groups:
- Processors: manufacture the product in a provincially licenced or federally registered facility.
- Further processors: use the product in its manufacturing operations and product formulation.
- Distributors: buy the product and resell it to other businesses.
Processors are not eligible for the Milk and Concentrated Milk TRQs. Further processors are not eligible for the Cheeses of All Types and Cream TRQs. Canada distributes CUSMA dairy import allocations according to the market shares of the eligible businesses who apply for import permits.
The United States argues that excluding retailers and food-service operators limits the effectiveness of the market-access commitments and contributes to lower utilization rates. Why aren’t retailers and food services included as eligible groups? What follows is my understanding of the situation.
After the signing of CETA, CPTPP and CUSMA, the federal government granted significant compensations to farmers for the loss of future production because of competition from imports. However, no compensations have been offered to other firms handling dairy products. Giving import rights to processors, further processors and distributors is a way to compensate them for handling smaller volumes of domestic products. In contrast, dairy products, whether produced domestically or imported, pass through retailers and food services for sale to consumers. There is therefore less justification for directing compensation toward retailers and food services.
The exclusion of retailers and food-service operators does not imply an attempt to restrict imports. In my view, the government sought to direct the economic value associated with TRQs toward processors, further processors and distributors, who were seen as more directly affected by increased import competition. I’ll argue in a future post that this does not affect TRQ utilization rates.
Utilization rate and the administration of TRQs
As discussed above, there are three components to a TRQ: the in-quota tariff, the quota volume and the over-quota tariff. Many consider the quota administration method as the fourth component. TRQ administration refers to how the rights to import at the in-quota tariffs are distributed. Quota administration can be an important factor in explaining utilization rates. Indeed, a country may administer its TRQs in ways that keep them from getting filled even when market conditions are favourable. There are several papers in the literature that discuss TRQ administration. Most were published about 25 years ago in the years following the creation of the WTO. I will go briefly over some of the ideas they discuss.2
One possible reason for underfill is complicated and onerous administrative mechanisms that act as a non-tariff barrier (NTB) to trade. The NTB comes from mechanisms requiring importers (or exporters) to incur meaningful, unduly, transaction costs to comply with the administration of the TRQ. Examples would be firms having to jump through hoops, in excess of normal procedures, to obtain the necessary permit because of convoluted product definitions and opaque application rules. Effectively, NTB lower the import demand. For example, in Figure 6, it could be that the import demand free of NTB is at \(D3\) and the import quota would be filled. Transaction costs associated with TRQ administration could reduce the import demand to \(D2\), causing underfill of the import quota.
TRQ use may come with specific conditions, such as time limits, past trading performance, seasonal quotas, and domestic purchase requirements. Some conditions, like use-it-or-lose-it, favour a high utilization rate, and firms may even import at the over-quota tariff to ensure keeping their import permits in the future.
Consumer preferences for Canadian dairy Products
One assumption in Figure 6 is that domestic and imported products are identical. In practice, this may not be the case and, even if they differ only marginally, consumers could perceive them as significantly different because they infer information from the country of origin. Consumer perception can influence consumption positively or negatively. For example, consumers may be willing to pay a premium for French cheese and they may heavily discount Chinese cheese because China is not known for its cheese production. Sometimes, what may appear as NTB can be explained by consumer preferences.
Consumer preferences for dairy products according to origin can vary considerably across products and origin. There is a voluminous literature on consumers’ willingness to pay for food attributes. Typically, studies find that consumers are willing to pay a premium for domestic products. As consumers infer quality based on origin and because it can be relatively inexpensive to signal, firms use labels to indicate origin when it is perceived positively by consumers. In Canadian dairy, it is the Blue Cow logo developed by the Dairy Farmers of Canada that signals to consumers that dairy products are 100% made of Canadian milk.
The logo is widely recognized by consumers and adopted by the industry. Dairy Farmers of Canada (2021) observes that the Blue Cow logo is one of the three most influential and trusted logos in Canada and recognized by nine out of ten Canadians. As evidence of its value, nearly 9,000 products feature the logo (Dairy Farmers of Canada, 2025) and 88% of Canadians would prefer a product with the Blue Cow logo over a product without the logo (Dairy Farmers of Canada, 2021).
Forbes-Brown, Micheels and Hobbs (2016) estimate Canadian consumers’ willingness to pay for milk and ice cream products bearing the Blue Cow logo. Findings from the study include the following:
- 94% for milk respondents and 90% for ice cream respondents were aware of the 100% Canadian Milk symbol.
- The average premium respondents were willing to pay for 100% Canadian Milk was a statistically different-from-zero $2.29 for a 2-litre carton of milk.
- The average premium respondents were willing to pay for 100% Canadian Milk was $1.56 for a 2-litre carton of ice cream. That value is statistically different from zero.
Norris and Cranfield (2019) estimate Canadian consumers’ preferences for cheddar cheese, Gouda cheese, ice cream and yogurt bearing country-of-origin labels. The study estimates using two econometric model the value associated with products coming from selected countries compared to products of Canadian origin. From two econometric models, Norris and Cranfield (2019) find that Canadian consumers discount US dairy products on average by the following percentages:
- Cheddar cheese: -34.85% and -41.39%;
- Gouda: -42.62% and -46.73%;
- Ice cream: -37.71% and -41.90%;
- Yogurt: -49.52% and -47.66%;
Slade, Josephson and Michler (2019) estimate willingness to pay for asiago, feta and gorgonzola cheeses with specific labels for geographical indications. The authors employ data collected through an online survey with 833 respondents. The products were considered coming from four origins: 1) Canada, 2) the United States, 3) the respondent’s province, and 4) the country associated with the specialty cheese (Italy for asiago and gorgonzola, and Greece for feta). The main findings of the study are:
- Canadians prefer Canadian, local (same province) and European cheeses over US cheese. They also prefer Canadian and local cheese over European cheese.
- For a 100 g block of cheese, the premium for “Made in Canada” compared to “Made in the USA” was $1.88, for “Made in province,” i.e., locally, it was $2.20 and for “Made in EU” it was $1.31.
Slade, Josephson and Michler (2019) observe that
Over 75% of the Canadian cheese market is cheddar, cream cheese, and mozzarella (CanadaDairy, nd)—these low-priced cheeses are unlikely to see significant imports from the EU. Instead, the bulk of EU cheese imports will likely be in the form of higher value cheeses, such as asiago, feta, or gorgonzola.
That is, Slade, Josephson and Michler (2019) surmise from their results that differentiated cheeses will make it on the Canadian market as consumers value them.
We can illustrate the effect of consumers preference for domestic products using Figure 6. First, suppose a case where consumers do not have preferences for domestic products over imported products and let the import demand be at \(D3\). Second, consider a case where consumers prefer domestic products over imported products. In comparison to the reference case where consumers have no preference regarding the country of origin, the demand for imported products is lower if consumers prefer domestic products. Depending on the strength of the relative preference for domestic products, the import demand could be at \(D2\) or \(D1\) in Figure 6, leading to a lower utilization rate. Consumer preferences can change over time. If preferences for domestic products over imported products become stronger, imports decline and the utilization rate is lower.
On the opposite case where consumers prefer imported products over domestic products, the import demand is stronger relative to reference case. In that case, the import demand could be at \(D4\) in Figure 6. This means that the utilization rate is higher when consumers prefer imported products over domestic products. If preferences for the imported products become stronger, imports increase.
The takeaway is that Canadian consumers prefer Canadian products and accordingly they are willing to pay more for dairy products of Canadian origin. As a result, it means that it is not because prices for certain dairy products are lower in the United States that we can expect them to flood the Canadian market. Canadian consumers will purchase US dairy products but their prices need to be much lower than equivalent Canadian dairy products. And, the discount necessary for Canadian consumers to purchase US dairy products is likely higher now given the anti-American sentiment since the election of President Trump.
Conclusion
This blog post offers background knowledge regarding Canadian dairy imports and the CUSMA disputes with the United States. Its goal is to give the necessary knowledge to understand how dairy imports function and why the United States is not happy with Canada’s dairy TRQs administration.
We learned from the figure for the utilization data that Canada’s two main dairy imports are butter and cheese. Butterfat has been, until recently, the relatively scarce and more expensive dairy component in Canada. It is therefore not too surprising that Canada imports large quantities of butter. The data also show that Canadians like good cheese. TRQs for Cheeses of All Types are virtually filled for the three trade agreements. These imports often are for differentiated cheese products, especially from Europe. Canadian consumers recognize the quality of these products and demand them. In contrast, imports for commodity cheeses, i.e., industrial cheeses, are lower, reflecting the lower demand for them.
This blog post explains the economics of TRQs and how Canada administers its dairy TRQs. It also discusses how NTB can cause a lower utilization rate and how consumer preferences can shape imports. Canadian consumers have strong preferences for Canadian dairy products.
Although a Panel ruled in favour of Canada in the second CUSMA dairy dispute, the United States continues to express discontent regarding Canada’s dairy TRQs administration. Notably, the United States considers that Canadian retailers should be eligible to obtain import allocations. In the next post, I will build from the material above to analyse Canada’s dairy imports. I will argue that giving allocations to retailers would not affect TRQ utilization rates.
Footnotes
New Zealand initiated later a similar dispute settlement process under CPTPP. The Panel ruled in favour of New-Zealand on certain claims. Canada modified CPTPP dairy TRQ allocations in response. New-Zealand claimed that Canada did not comply with the Panel findings and requested compensations. Canada and New Zealand agreed to a solution in July 2025 and the dispute was resolved.↩︎
The literature on the administration of TRQs include Abbott (2002), Barichello (2000), Beckman, Gale and Lee (2021), Boughner, de Gorter and Sheldon, Skully (1999), Skully (2001a) and Skully (2001b).↩︎